Commodity prices matter to everyday investors because they are the economy's raw inputs, priced in public every trading day. Gold near $4,337 per troy ounce, up 15.21% year over year as of Sep/22 per Trading Economics, tells one story about money and fear. Oil, copper, and wheat tell others about growth, industry, and food costs.
You do not need to trade any of them to benefit from watching. Commodity moves often lead or confirm what bond markets, central banks, and risk assets, including bitcoin, do next. The signal is in the direction and the pace, not in any single print.
What are commodities, exactly?
A commodity is a standardized raw good: a barrel of Brent crude is the same barrel no matter who sells it. That standardization is the whole point. Because every unit is interchangeable, the price is set by global supply and demand rather than by any brand or seller.
Markets group them into a few families. Energy covers crude oil, natural gas, and coal. Metals split into precious metals like gold and silver, and industrial metals like copper and aluminum. Agriculture covers grains, softs like coffee and sugar, and livestock. Commodity.com tracks live prices for 54 commodities across those groups, plus cryptocurrency, updated every 60 seconds during market hours.
Most investors never touch the physical good. Exposure comes through futures contracts, ETFs, or the shares of producers. That distinction matters, because futures-based products carry costs and mechanics that the spot price on a dashboard does not show.
Why does gold move the way it does?
Gold pays no interest and produces nothing. Its price is driven by what investors expect elsewhere: real interest rates, currency strength, and demand for a store of value outside the banking system. When real yields fall or trust in fiat money wobbles, gold tends to attract flows. When cash pays well, gold competes badly.
The current tape makes the point. Gold sat at $4,336.67 per troy ounce, showing a 1.03% monthly gain but a 6.78% year-to-date decline, with a 15.21% year-over-year rise, per Trading Economics as of Sep/22. Silver told a different story: $65.96 per ounce, down 7.44% year to date but up 49.77% year over year. Precious metals can move together and still disagree about timing.
For a crypto-literate reader, gold is the oldest attempt at what bitcoin tries to be: a scarce, non-sovereign store of value. Comparing their behavior during the same stress periods is a legitimate analytical exercise, not a slogan.
What does oil signal about the economy?
Oil is the closest thing markets have to a real-time growth gauge. Higher prices usually mean strong demand or constrained supply; lower prices often mean demand is weakening or supply is abundant. Both directions carry information, and neither is automatically good or bad.
The current board shows why watching both benchmarks pays. Brent crude stood at $101.48 per barrel, up 1.14%, at 11:19 PM in Markets Insider's commodity table, while WTI printed $95.78, down 4.51%, at 2:32 PM the same day. A gap that wide between the two grades is itself a signal about regional supply conditions, and it is worth checking before treating either headline number as the whole story.
Energy prices feed directly into household costs. Gasoline at $3.48 per gallon and natural gas at $2.85 per MMBtu, both from the same Markets Insider table, show up in consumers' bills weeks later. That pass-through is why central banks watch commodity prices when weighing inflation.
Why is copper called the economy's doctor?
Copper goes into wiring, plumbing, motors, and grid infrastructure. Its price rises when construction and manufacturing are busy and falls when they stall. Traders call it a diagnostic metal because it reacts early and honestly to industrial demand.
The recent readings are loud. Copper at $6.75 per pound was up 47.27% year over year and 18.83% year to date, per Trading Economics as of Sep/22. Tin, used in electronics, was up 57.16% year over year. When industrial metals run that hard while gold slips year to date, the tape is describing an industrial-demand story more than a fear story.
Our analysis: read metals as a group, not as singles. Copper, aluminum, and zinc rising together points to broad demand. One metal spiking alone usually means a supply problem in that specific market, which says little about the economy.
What this means for crypto and macro traders
Commodities and crypto sit in the same macro weather system. Inflation expectations, the dollar's strength, and central bank policy move both. A trader who watches the dollar index alongside gold and oil has most of the context needed to interpret a sharp bitcoin move. The same rate expectations that lift or sink gold often do the same to digital assets, with more volatility attached.
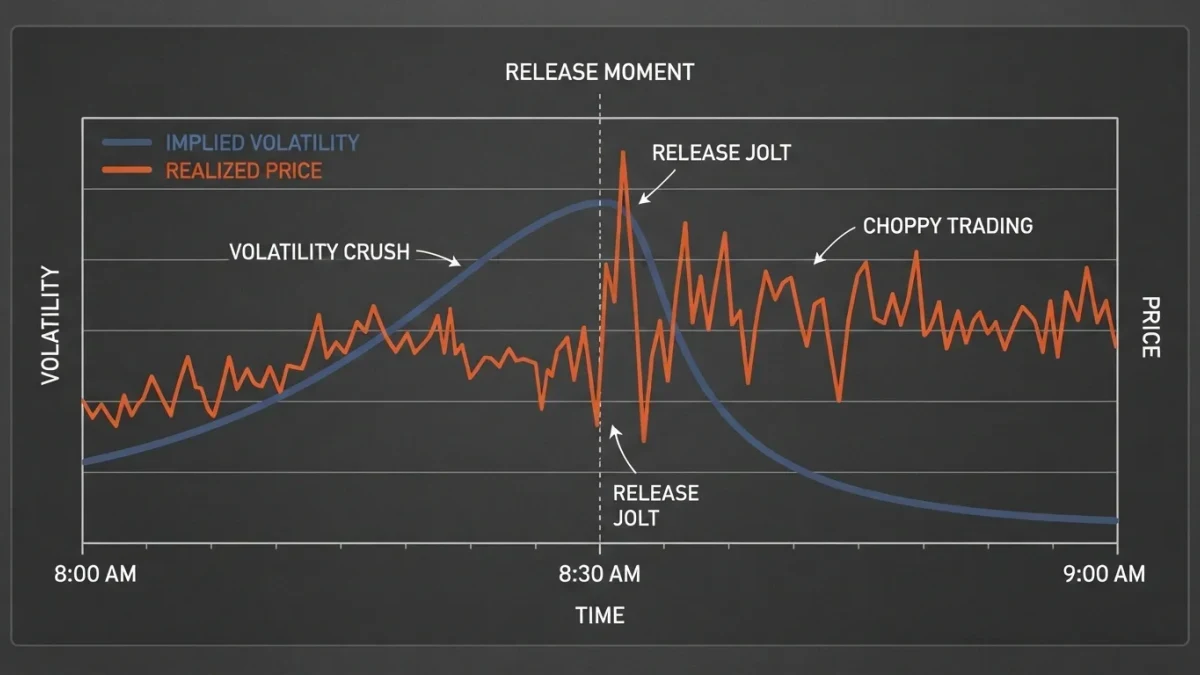
Practical steps cost nothing. Check a commodity dashboard before and after major macro releases. Note whether gold and the dollar move together or apart. Watch whether oil's direction confirms or contradicts what equity and crypto markets are pricing. For readers who want the mechanics spelled out, our pieces on how macro data releases move crypto prices and what the dollar index tells crypto traders cover the transmission in detail.
None of this is a trading signal on its own. Commodity prices are inputs to a view, not conclusions. Crypto markets are volatile and losses are possible in every direction, and no dashboard reading changes that.
Where the signals run out
Commodity boards summarize supply and demand, but they cannot tell you why a move happened. A 5% jump in orange juice or a slide in coffee, both visible in the current tables, may reflect weather, freight, speculation, or a data quirk. Attribution requires reporting, not just a price feed. Live quotes are also delayed and for informational purposes only, as Commodity.com states on its price page, so execution decisions need different data.
The durable takeaway is modest and real. Commodities are the economy's invoice, itemized. Gold prices the demand for money outside the system. Oil prices the demand for growth. Copper prices the demand for building. Reading the invoice does not tell you what to buy. It tells you what the world is actually doing, which is where every sound view starts.